

13 Jul 2026
Four-Probe Measurement of Semiconductor Band Gap
Aim
To measure the resistivity of a semiconductor at different temperatures by the four-probe method and determine its energy band gap.
Apparatus
Four-probe semiconductor unit, constant-current source, microvoltmeter, heater, thermometer, temperature controller, and regulated power supply.
Experimental arrangement
Theory
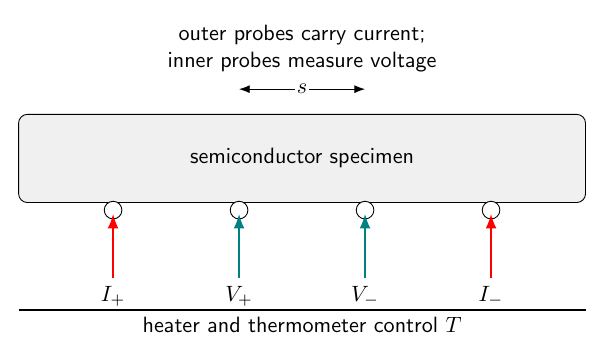
The four probes are placed in a straight line on the semiconductor surface. A known current is passed through the two outer probes, while the two inner probes measure only the potential difference. Since the voltage probes draw negligible current, contact and lead resistances do not appreciably affect the measurement.
For a specimen with geometrical correction factor $G$,
\[\rho=G\frac{V}{I},\qquad \sigma=\frac{1}{\rho}.\]In an intrinsic semiconductor, thermal energy creates electron-hole pairs. The carrier concentration therefore increases exponentially with temperature and
\[\sigma=\sigma_0\exp\left(-\frac{E_g}{2kT}\right).\]Taking common logarithms,
\[\log_{10}\sigma=\log_{10}\sigma_0-\frac{E_g}{2.303k}\frac{1}{T}.\]Thus the slope $s$ of the graph of $\log_{10}\sigma$ against $1/T$ gives
\[E_g=-2.303ks.\]Observations
Constant current: $I=2.0$ mA; geometrical factor: $G=1$.
| Temperature (K) | Probe voltage (mV) | Resistivity (ohm m) | Conductivity (S m$^{-1}$) |
|---|---|---|---|
| 303 | 18.2 | 0.910 | 1.10 |
| 313 | 12.8 | 0.640 | 1.56 |
| 323 | 8.8 | 0.440 | 2.27 |
| 333 | 6.0 | 0.300 | 3.33 |
| 343 | 4.0 | 0.200 | 5.00 |
Graph
Calculation
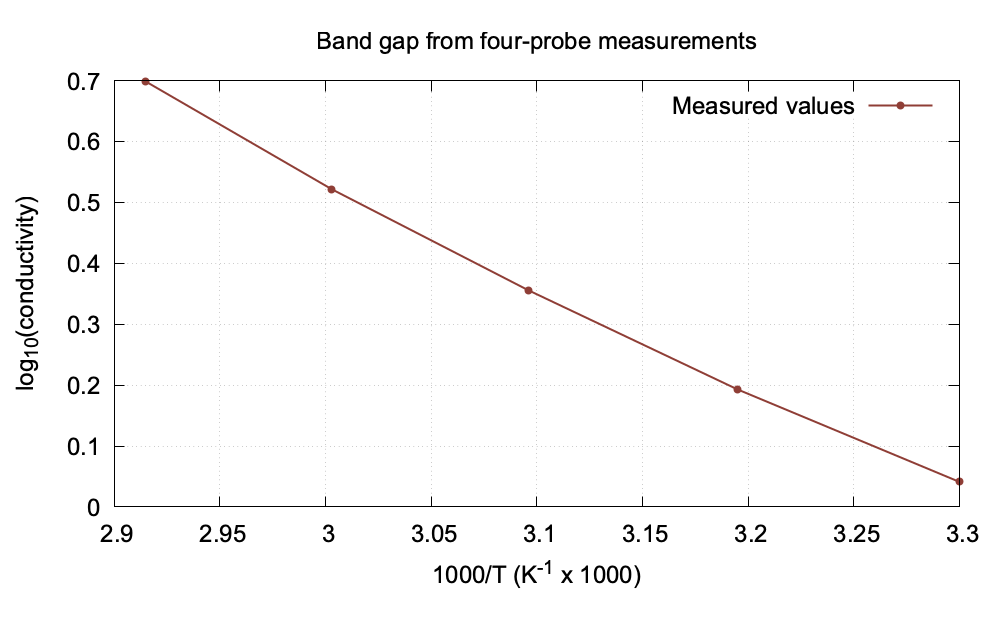
From the graph, the slope with respect to $1000/T$ is approximately $-3.36$. Therefore the slope with respect to $1/T$ is $-3360$ K and
\[E_g=-2.303(8.617\times10^{-5})(-3360)=0.67\text{ eV}.\]Result
The energy gap of the supplied semiconductor is
\[\boxed{E_g\approx0.67\text{ eV}}.\]Viva Questions
- Why are four probes used? The inner probes measure voltage without carrying the current used to excite the sample.
- Why does conductivity increase with temperature? More electrons and holes are thermally excited across the energy gap.
- Why is a graph used? Its slope removes the unknown constant $\sigma_0$ and gives $E_g$ directly.


Discussion