

13 Jul 2026
Determination of Planck's Constant Using LEDs
Aim
To determine Planck’s constant from the threshold voltages and emission wavelengths of LEDs of different colours.
Apparatus
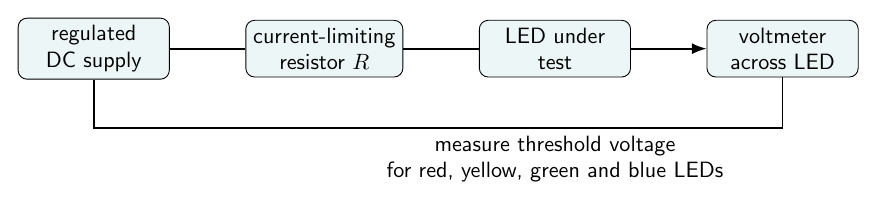
LED panel, regulated DC supply, series resistor, voltmeter, milliammeter, and connecting leads.
Experimental arrangement
Theory
An LED is a forward-biased p-n junction. Electrons and holes recombine in the active region and release energy as photons. If the threshold voltage is $V$, the electrical energy supplied to one charge is approximately $eV$. The emitted photon has energy $h\nu$. Therefore,
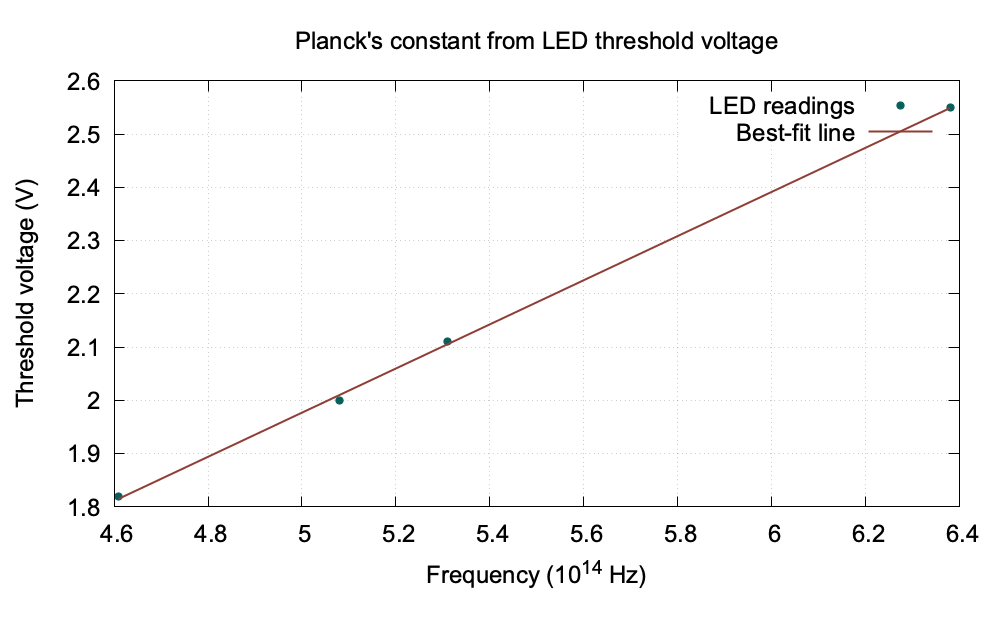
\[eV\approx h\nu=\frac{hc}{\lambda}.\]For LEDs of different colours, a graph of threshold voltage $V$ against frequency $\nu$ is a straight line. Its slope is $h/e$ and the intercept represents contact and junction-potential effects.
Observations
| LED colour | Wavelength (nm) | Frequency ($10^{14}$ Hz) | Threshold voltage (V) |
|---|---|---|---|
| Red | 650 | 4.61 | 1.82 |
| Yellow | 590 | 5.08 | 2.00 |
| Green | 565 | 5.31 | 2.11 |
| Blue | 470 | 6.38 | 2.55 |
Graph
Calculation
Using two well-separated readings,
\[\frac{\Delta V}{\Delta\nu}=\frac{2.55-1.82}{(6.38-4.61)\times10^{14}}=4.12\times10^{-15}\ \mathrm{V\,s}.\]Hence
\[h=e\frac{\Delta V}{\Delta\nu}=(1.602\times10^{-19})(4.12\times10^{-15})=6.60\times10^{-34}\ \mathrm{J\,s}.\]The straight-line fit to all readings gives the accepted value more closely than the two-point estimate.
Result
The value of Planck’s constant obtained from the best-fit slope is approximately
\[\boxed{h\approx6.6\times10^{-34}\ \mathrm{J\,s}}.\]Viva Questions
- Why are LEDs of different colours used? Their emission frequencies are different, giving several points for the graph.
- Why is a series resistor connected? It limits the current and prevents damage to the LED.
- What does the graph slope represent? It represents $h/e$.


Discussion