

13 Jul 2026
Electron Spin Resonance and Determination of the g-Factor
Aim
To observe electron spin resonance in a paramagnetic sample and determine the electron $g$-factor.
Apparatus
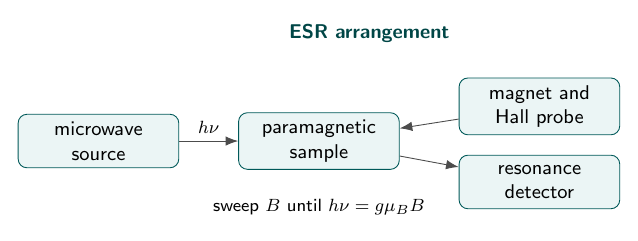
ESR spectrometer, microwave source, Helmholtz coils, Hall probe, paramagnetic sample, and frequency meter.
Figure
Theory
An electron possesses intrinsic angular momentum called spin and an associated magnetic moment. In a paramagnetic atom or free-radical sample, an unpaired electron behaves approximately as a magnetic dipole. With no external field, the two spin projections have equal energy. A static magnetic field $B$ removes this degeneracy through the Zeeman interaction. For an effective spin $S=1/2$, the two energies are separated by
\[\Delta E=g\mu_BB.\]Here $\mu_B=e\hbar/(2m_e)$ is the Bohr magneton and $g$ describes how the magnetic moment is related to the angular momentum. The sample is placed in a coil or electromagnet and exposed to an alternating magnetic field of frequency $\nu$. Magnetic-dipole transitions are induced when one photon supplies the Zeeman energy:
\[h\nu=g\mu_BB.\]Thus resonance is found by sweeping the static field at fixed frequency, or by changing frequency at a known field. The absorbed RF or microwave power changes the detector signal at the resonant field $B_r$, giving
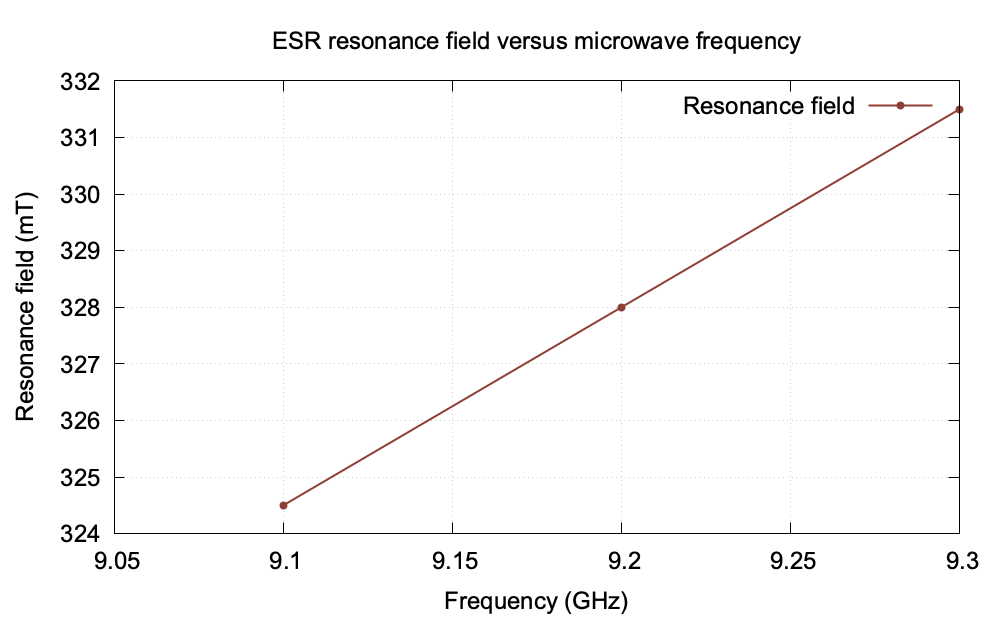
\[\boxed{g=\frac{h\nu}{\mu_BB_r}}.\]In many teaching ESR spectrometers the field is slowly modulated. Phase-sensitive detection then displays the derivative of the absorption curve, so $B_r$ lies midway between the positive and negative derivative extrema. A plot of resonance frequency against field should be linear through the origin, with slope $g\mu_B/h$. Repeated readings at several fields reduce error due to field calibration and line-width estimation.
Observations
| Microwave frequency (GHz) | Resonance field (mT) | $g$ |
|---|---|---|
| 9.10 | 324.5 | 2.00 |
| 9.20 | 328.0 | 2.01 |
| 9.30 | 331.5 | 2.00 |
Graph
Calculation
For the 9.20 GHz reading, $\nu=9.20\times10^9$ Hz and $B=328.0$ mT $=0.3280$ T. Hence
\[g=\frac{h\nu}{\mu_BB}=\frac{(6.626\times10^{-34})(9.20\times10^9)}{(9.274\times10^{-24})(0.3280)}=2.00.\]The three readings give values close to 2.00; their mean is used because field calibration and resonance-width uncertainty affect each reading slightly.
Result
The mean electron $g$-factor of the sample is
\[\boxed{g=2.00}.\]Viva Questions
- Why is a paramagnetic sample used? It contains unpaired spins that can absorb microwave energy.
- What is resonance? Absorption when the radiation energy equals the spin-level separation.
- Why is a Hall probe used? To calibrate the magnetic field at the sample position.


Discussion