

13 Jul 2026
Four-Probe Resistance of a Semiconductor and Determination of Band Gap
Aim
To measure the resistance of a semiconductor by the four-probe method at different temperatures and determine its energy gap.
Apparatus
Four-probe semiconductor unit, constant-current source, microvoltmeter, heater, thermometer, and regulated power supply.
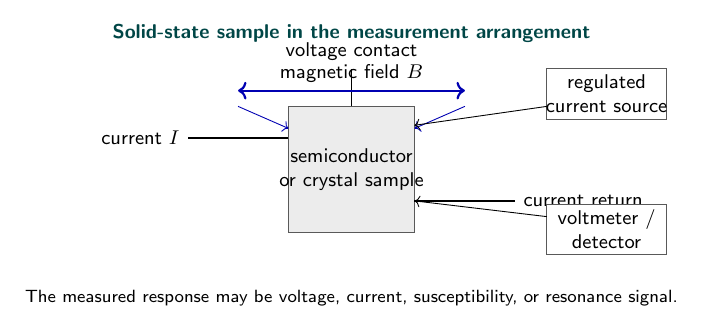
Experimental arrangement
Theory
In an ordinary two-terminal resistance measurement, the observed voltage includes the drops across the specimen, leads, and metal-semiconductor contacts. The four-probe arrangement separates these functions. A known current $I$ is passed through the two outer collinear probes, while a high-resistance voltmeter measures $V$ between the inner probes. Since negligible current enters the voltage probes, their contact resistances produce negligible voltage drop.
The current spreads through the semiconductor, so the conversion from $V/I$ to resistivity depends on probe spacing $s$, specimen thickness $t$, and distance from an edge. For a thick, laterally large specimen,
\[\rho=2\pi s\frac{V}{I}.\]For a thin sheet with $t\ll s$,
\[\rho=\frac{\pi t}{\ln2}\frac{V}{I}.\]The practical kit combines the appropriate thickness and edge corrections into a geometrical factor $G$, so the working form is
\[\rho=G\frac{V}{I}.\]As temperature rises in the intrinsic region, thermal energy excites electrons from the valence band to the conduction band, leaving an equal concentration of holes. The intrinsic carrier concentration varies as $n_i\propto e^{-E_g/(2kT)}$, and therefore
\[\sigma=\frac1\rho=\sigma_0e^{-E_g/(2kT)}.\]Taking common logarithms gives
\[\log_{10}\sigma=\log_{10}\sigma_0-\frac{E_g}{2(2.303)k}\frac1T.\]If the slope of the straight-line intrinsic region in a plot of $\log_{10}\sigma$ against $1/T$ is $m$, then
\[\boxed{E_g=-2(2.303)km}.\]The factor of two is essential because each excitation creates an electron-hole pair. A constant probe current must be low enough to avoid self-heating, and only the linear intrinsic region should be used for the band-gap fit.
Observations
| Temperature (K) | Current (mA) | Probe voltage (mV) | Resistivity (ohm m) |
|---|---|---|---|
| 303 | 2.0 | 18.2 | 0.91 |
| 313 | 2.0 | 12.8 | 0.64 |
| 323 | 2.0 | 8.8 | 0.44 |
| 333 | 2.0 | 6.0 | 0.30 |
| 343 | 2.0 | 4.0 | 0.20 |
For this trial sheet, the geometrical correction factor is $G=0.10\,\text{m}$.
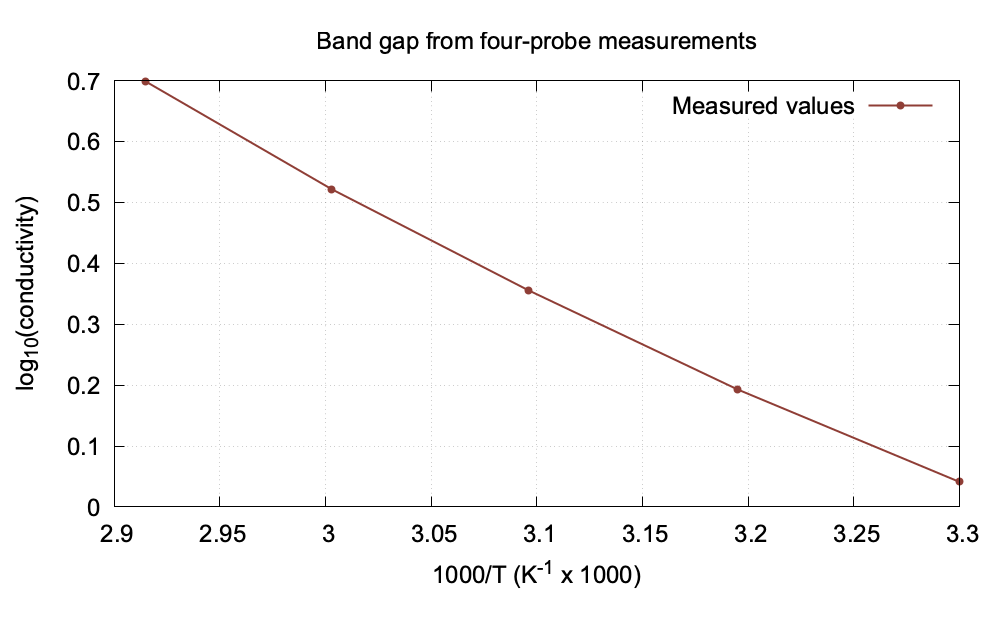
Graph
Calculation
For the first reading,
\[\rho=G\frac{V}{I}=0.10\frac{18.2\times10^{-3}}{2.0\times10^{-3}}=0.910\,\Omega\,\text{m}.\]Therefore,
\[\sigma=\frac{1}{\rho}=\frac{1}{0.910}=1.10\,\text{S m}^{-1}.\]The graph is plotted against $1000/T$. Its slope is approximately $-1.71$ per unit of $1000/T$, which corresponds to $-1710$ K when the horizontal variable is $1/T$. Hence
\[E_g=-2(2.303)(8.617\times10^{-5})(-1710)=0.68\,\text{eV}.\]Result
The semiconductor shows decreasing resistivity with increasing temperature, and the energy gap obtained from the graph is
\[\boxed{E_g\approx0.68\,\text{eV}}.\]Viva Questions
- Why are four probes used? The voltage contacts carry negligible current, so contact resistance has little effect.
- Why is the sample heated gradually? To maintain thermal equilibrium and avoid temperature gradients.
- What indicates semiconductor behaviour? Its resistance decreases as temperature increases.


Discussion