

13 Jul 2026
Determination of Planck's Constant Using LEDs
Aim
To determine Planck’s constant using the threshold voltages of LEDs of different colours.
Apparatus
LED panel, regulated DC supply, series resistor, voltmeter, milliammeter, and connecting leads.
Experimental arrangement
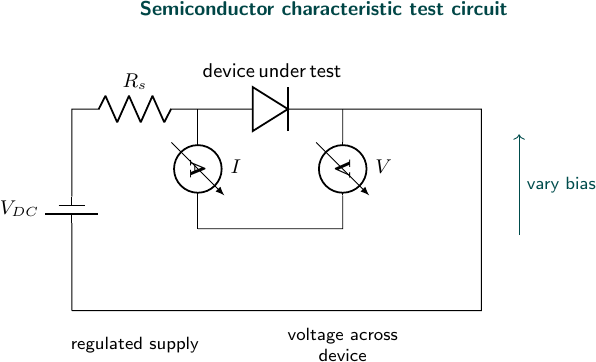
Theory
An LED is a p-n junction made from a direct-band-gap semiconductor. Under forward bias, electrons are injected from the n-side and holes from the p-side into the active region. Their radiative recombination releases energy approximately equal to the band gap $E_g$ as a photon. Photon energy and optical frequency are related by Planck’s law,
\[E_\gamma=h\nu=\frac{hc}{\lambda}.\]The electrical work supplied to one carrier crossing a potential difference $V$ is $eV$. Near the onset of visible emission, these energies are approximately related by
\[eV\approx h\nu=\frac{hc}{\lambda}.\]The equality is not exact for one LED because some applied voltage is associated with contact potential, series resistance, non-radiative recombination, and the subjective choice of threshold current. These contributions can be represented approximately by a common intercept $V_0$:
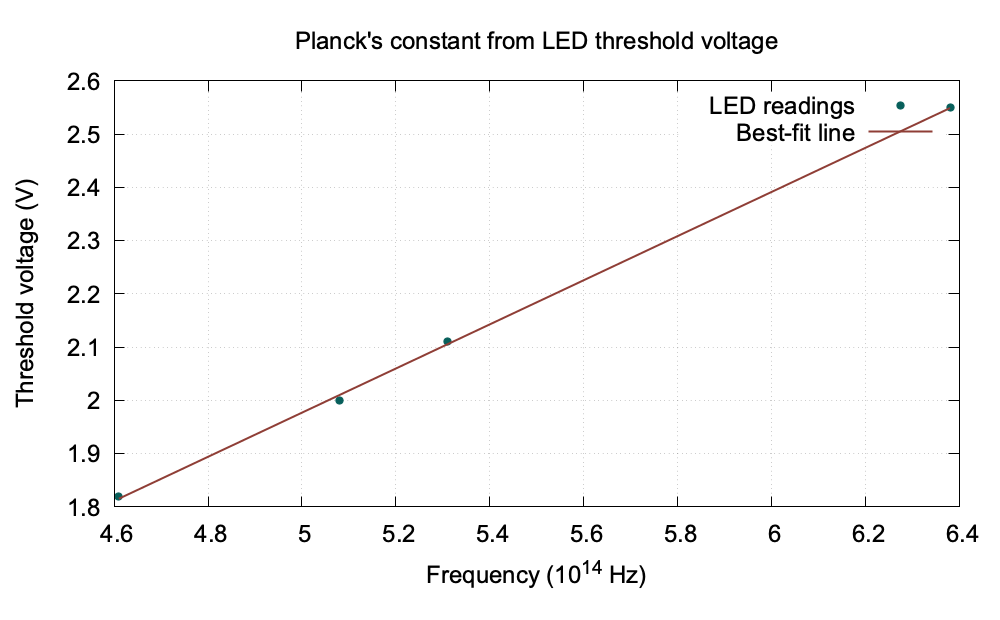
\[V=\frac{h}{e}\nu+V_0.\]Using several LED colours and plotting measured threshold voltage against frequency separates the physically useful slope from this intercept. Since $\nu=c/\lambda$, the gradient is
\[h=e\frac{\Delta V}{\Delta\nu}.\]The wavelength used should be the peak emission wavelength, not merely the printed colour name. Threshold voltage should be measured at the same small current for every LED because forward voltage depends on current and temperature. A straight-line fit through all readings is preferable to a single ratio $eV/\nu$, which incorrectly assumes a zero intercept.
Observations
| LED colour | Wavelength (nm) | Frequency ($10^{14}$ Hz) | Threshold voltage (V) |
|---|---|---|---|
| red | 650 | 4.61 | 1.82 |
| yellow | 590 | 5.08 | 2.00 |
| green | 565 | 5.31 | 2.11 |
| blue | 470 | 6.38 | 2.55 |
Graph
Calculation
Using the red and blue readings,
\[\frac{\Delta V}{\Delta\nu}=\frac{2.55-1.82}{(6.38-4.61)\times10^{14}}=4.12\times10^{-15}\,\text{V s}.\]Therefore,
\[h=e\frac{\Delta V}{\Delta\nu}=(1.602\times10^{-19})(4.12\times10^{-15})=6.60\times10^{-34}\,\text{J s}.\]The straight-line fit using all four observations reduces the effect of individual LED threshold uncertainty and gives the final value close to this endpoint estimate.
Result
The value of Planck’s constant obtained from the LED graph is approximately
\[\boxed{h\approx6.6\times10^{-34}\,\text{J s}}.\]Viva Questions
- Why are LEDs of different colours used? Their emission frequencies are different.
- Why is a series resistor used? It limits current and protects the LED.
- What does the slope represent? $h/e$.


Discussion