

13 Jul 2026
Measurement of Voltage and Time Period of a Periodic Waveform Using CRO
Aim
To measure the peak-to-peak voltage, time period, and frequency of a periodic waveform using a cathode-ray oscilloscope.
Apparatus
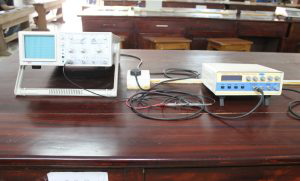
CRO, function generator, connecting leads, and a calibrated probe.
Apparatus image
Theory
A CRO displays the input voltage as a vertical deflection against time along the horizontal axis. If the waveform occupies $n_v$ vertical divisions and the vertical sensitivity is $S_v$ volts per division,
\[V_{pp}=n_vS_v.\]If one complete cycle occupies $n_t$ horizontal divisions and the time-base setting is $S_t$ seconds per division,
\[T=n_tS_t,\qquad f=\frac{1}{T}.\]Procedure
- Connect the function generator to the CRO input.
- Select a sinusoidal waveform and obtain a steady trace.
- Adjust intensity, focus, and vertical position.
- Count the vertical divisions between the positive and negative peaks.
- Count the horizontal divisions for one complete cycle.
- Substitute the readings in the formulae.
Observations
Vertical sensitivity: $S_v=2\,\text{V div}^{-1}$; time-base setting: $S_t=0.5\,\text{ms div}^{-1}$.
| Trial | Vertical divisions $n_v$ | $V_{pp}$ (V) | Horizontal divisions $n_t$ | $T$ (ms) | $f$ (Hz) |
|---|---|---|---|---|---|
| 1 | 3.0 | 6.0 | 4.0 | 2.0 | 500 |
| 2 | 3.1 | 6.2 | 4.0 | 2.0 | 500 |
| 3 | 3.0 | 6.0 | 4.0 | 2.0 | 500 |
Calculation
For the second observation,
\[V_{pp}=3.1\times2=6.2\,\text{V},\] \[T=4.0\times0.5=2.0\,\text{ms},\qquad f=\frac{1}{2.0\times10^{-3}}=500\,\text{Hz}.\]The peak voltage is $V_p=V_{pp}/2=3.1\,\text{V}$.
Result
The measured peak-to-peak voltage is
\[\boxed{V_{pp}=6.1\,\text{V}},\]and the frequency of the waveform is
\[\boxed{f=500\,\text{Hz}}.\]Precautions
- Do not exceed the maximum input voltage of the CRO.
- Obtain a stationary trace before counting divisions.
- Use the correct probe attenuation setting.
- Keep the time-base and sensitivity controls unchanged during a trial.
Viva Questions
- What does the vertical axis represent? It represents the instantaneous input voltage.
- What does the horizontal axis represent? It represents time through the sweep circuit.
- Why must the trace be stationary? A stationary trace permits accurate division counting.
- What is triggering used for? It synchronises the sweep with the waveform and stabilises the display.


Discussion